We Analyzed 2,700+ Scratch-Offs Across 42 U.S. Lotteries

Larry Nguyen
Founder of Scratch IQ
Written
Quick answer
As of July 12, 2026, the average active U.S. scratch-off game returns about 69 cents per dollar. Median returns rise with ticket price, from about 58 cents on $1 games to about 80 cents on $50 games, and about 10.9 percent of active games still sell with zero top prizes remaining.
Scratch IQ reads the remaining-prize tables that 41 state lotteries plus Washington, D.C. publish on their own websites, every day. This is what that dataset shows as of July 12, 2026, across 2,706 active games and 2.38 million prize-tier records: the average game returns about 69 cents per dollar, cheaper tickets pay back the least, and about 1 in 9 games on sale can no longer pay its advertised top prize.
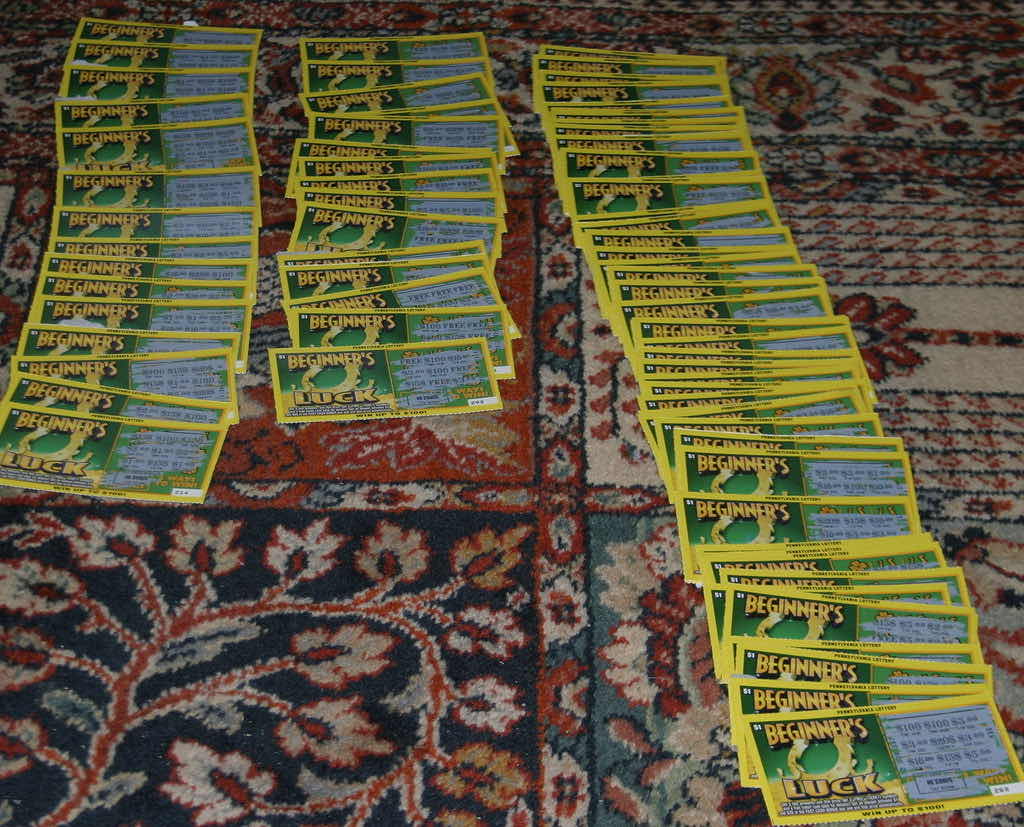
Why an engineer scraped 42 lotteries
In 2003, a retired factory manager named Jerry Selbee read the rules of a Michigan lottery game and noticed the math briefly worked in the player’s favor. He and his wife Marge made millions before the game closed, and they broke no rules. They just did arithmetic nobody else bothered to do.
I’m an aerospace engineer, and that story never left me alone. Scratch-offs publish their arithmetic too. Most state lotteries post, on their own websites, how many prizes at each level are still unclaimed in every active game. Almost nobody reads it. So I built a system that reads all of it, every day, across 41 states and Washington, D.C. This article is what that dataset says, in aggregate, as of July 12, 2026.
The numbers below cover 2,706 active scratch-off games and 2.38 million individual prize-tier records, collected every day since March 17, 2026. Every figure traces back to public lottery data, and the math we run on it is documented on our methodology page.
Finding 1: the average ticket returns about 69 cents per dollar
Across the 2,687 active games with published expected-value data (of 2,706 tracked), the average expected return is $0.69 for every $1 spent. The median game is nearly identical at $0.68. If the phrase “expected return” is new, our EV explainer walks through it, but the plain version is: for each dollar that goes into an average scratch-off, about 69 cents comes back out as prizes, spread across all players. The other 31 cents is the lottery’s.
That is not a scandal. It is how the products are filed and designed, and it is roughly in line with the payout percentages state lotteries publish for their scratch portfolios. What the averages hide is how much the individual games differ, which is where the rest of the findings come in.
Finding 2: the cheapest tickets are the worst deal
The clearest pattern in the entire dataset: expected return climbs with ticket price, at every step of the ladder.
| Ticket price | Active games | Median return per $1 |
|---|---|---|
| $1 | 240 | 58.3¢ |
| $2 | 387 | 62.4¢ |
| $3 | 196 | 64.1¢ |
| $5 | 691 | 68.0¢ |
| $10 | 568 | 71.8¢ |
| $20 | 352 | 74.7¢ |
| $30 | 157 | 77.8¢ |
| $50 | 75 | 79.5¢ |
A $1 ticket keeps about 42 cents of your dollar. A $50 ticket keeps about 20. The gap is not an accident: lotteries design higher price points with richer prize pools to justify the price tag, and the design shows up plainly in the published numbers. Sold by the dollar, the cheapest rack position is consistently the most expensive place to stand.
Finding 3: about 1 in 9 games on sale can no longer pay its top prize
As of July 12, 2026, 294 of the 2,704 active games with published prize-tier data (two of the 2,706 tracked games lack it), about 10.9 percent, show zero top prizes remaining. The jackpot printed in big numbers on the front of the ticket has already been claimed by someone else. The tickets stay on sale, and in most states that is legal and disclosed, if you know which webpage to check.
This is the single most practical thing in the dataset. Two tickets can sit side by side in the same case, same price, same art style, and one of them still has its million-dollar prize in circulation while the other physically cannot produce one. The only way to tell them apart is the remaining-prize table, which is exactly the public data most players never see. Florida, for example, publishes it for every game on the state lottery’s own site. A few lotteries publish less granular data whose tier counts we model from published odds (documented on the methodology page); excluding those states barely moves this figure. It stays right around 1 in 9.
Finding 4: your state matters more than you think
The median game in the strongest state returns about 77 cents per dollar (Massachusetts, across 133 active games). The median game in the weakest returns about 53 cents (Kansas, across 62 games). That is a 24-cent spread on every dollar, purely as a function of which side of a state line the gas station sits on.
The spread is a snapshot and it moves as games launch and retire, so we are not framing any state as permanently generous or permanently stingy. But the size of the gap is durable: state portfolios differ in price mix, payout design, and how quickly depleted games leave shelves. A handful of lotteries publish less granular data than the rest, and for those our methodology page documents how the numbers are modeled from published odds.
Finding 5: the Selbee pattern still exists, in miniature
On the day of this snapshot, 25 games, slightly under 1 percent of the active set, showed more prize value remaining than the cost of the tickets left to sell. This is the late-life pattern Jerry Selbee found: most tickets have sold, the big prizes haven’t hit, and for a while the arithmetic tilts.
Before anyone quits their job: a positive expected value is an average across an enormous number of tickets, not a prediction about the next one you touch, and the condition evaporates as prizes get claimed. Some of these 25 are also small games in small states where one claimed prize flips the sign overnight. The honest takeaway is narrower and more interesting: the public data is rich enough to watch this pattern appear and disappear in near real time, across the whole country. That is a thing you can only see if something reads all 42 prize tables every day.
Where the data comes from
Scratch IQ collects remaining-prize counts from the public websites of 41 state lotteries plus Washington, D.C., once per day, and recomputes each game’s expected value from the published tier counts and overall odds. The formula, the update schedule, and the per-state caveats are documented on the methodology page. The statistics in this article are a July 12, 2026 snapshot of that dataset: 2,706 active games, 2.38 million prize-tier records, collected daily since March 17, 2026. Journalists and researchers are welcome to cite these figures with the date attached; if you need a cut of the data we haven’t published, get in touch.
Related questions
- What percentage of scratch-off money is paid back as prizes?
- Across the 2,687 active games with published expected-value data in 42 U.S. lottery jurisdictions, the average game returns about 69 cents per dollar as of July 12, 2026. The exact figure varies by game, price point, and state.
- Do more expensive scratch-offs have better payouts?
- Yes, on average. In the July 2026 snapshot the median $1 game returned about 58 cents per dollar while the median $50 game returned about 80 cents. Expected return rose with price at every tier in between.
- Can a scratch-off game keep selling after its top prize is claimed?
- Yes, in most states. As of July 12, 2026, about 10.9 percent of active games showed zero top prizes remaining while still on sale. Most state lotteries disclose remaining-prize counts on their websites.
Scratch IQ is independent and is not affiliated with, endorsed by, or sponsored by any state lottery commission. This article is informational only — not gambling, financial, or investment advice. Every scratch-off ticket is random; past rankings do not predict individual outcomes.
You must be 18 or older (or your state’s minimum lottery age, whichever is higher) to play. Play responsibly.